Copy Number Variation (CNV) Analysis: Complete Guide (2022)

High-quality detection of CNVs from NGS data has been a challenge for many years. This guide explains the basics of NGS-based CNV analysis, the methods used to accomplish it, and the tools clinical research labs use to detect and interpret CNVs, SNVs, and AOH from almost all NGS assays with high sensitivity and low false-positive rates.

Introduction

Copy number variations (CNVs) are genomic alterations that result in abnormal copies of one or more genes. Structural genomic events such as duplications, deletions, translocations, and inversions can cause CNVs.

Like single-nucleotide polymorphisms (SNPs), particular CNVs have been associated with susceptibility to diseases such as cancer, inherited genetic disorders, autoimmune diseases, and others.

At Bionano Genomics, we equip clinical research labs with NxClinical, which we believe may be the most comprehensive and up-to-date cytogenetics, and molecular genetics solution. It’s one system for analyzing and interpreting all genomic variants from microarray and next-generation sequencing (NGS) data.

1Brief Introduction to NGS-Based Copy Number Analysis

The development of NGS technology has dramatically improved our ability to detect all types of genomic variations, from single nucleotide variant (SNV) to CNV and other structural variations. Using NGS data for CNV analysis has gained huge attention in recent years thanks to new technologies and better algorithms that enable the simultaneous detection of CNVs and SNVs.

Since NGS technology is now the most common method for high throughput assessment of Sequence Variants (SeqVar) with wide acceptance, the ability to also obtain CNV and LOH status of a sample from NGS is very appealing as it would mean a single workflow and reduced cost.

NGS-based CNV analysis techniques also enable labs to map the precise location of a variant (depending on the detection approach).

2How NGS-Based CNV Calling and Analysis Works

There are four main methods of detecting CNVs with NGS data:

  1. Read-Pair (RP)
  2. Split-Read (SR)
  3. Read-Depth (RD)
  4. Assembly (AS)

Each of these four methods specializes in detecting a specific form or size range of CNV, resulting in a trade-off in breakpoint accuracy. None of these methodologies is perfect; each brings advantages and disadvantages. To address this, many labs combine different methods, such as read-depths with read-pairs, or read-depths with split-reads, to achieve a more holistic analysis.

As Dr. Fen Guo, Clinical Laboratory Director at PerkinElmer Genomics notes, the utility of these methods often hinges on the quality of the NGS data available.

“There’s a general sense that some methods are better than others—for example, that the split-read method is superior for accurate breakpoint identification because of the nature of this methodology, while the read-depths can detect the dosages of CNVs and works better on a wide range of CNV sizes from small to large CNVs in the genome. But in addition to recognizing the inherent differences between these methods and what they’re capable of, so much depends on the quality of the data—the read depths, the coverage, and the data uniformity.”

— Dr. Fen Guo, Ph.D., FACMG, FCCMG, Clinical Laboratory Director at PerkinElmer Genomics

To give a little more background and tease out some of these important nuances, we briefly summarize each NGS CNV calling method below.

Read-Pair

The read-pair methodology was the first to demonstrate the usefulness of NGS data for CNV detection.

It works by comparing the insert size between the actual sequences’ read-pairs with the expected size based on a reference genome. Labs using this method can identify CNVs by mapping the discordance between mapped paired reads whose distances significantly differ from the predetermined average insert size.

  • The read-pair method can detect medium-sized (100kb to 1Mb) insertions and deletions from mapped data. However, this method is insensitive to small insertion or deletion events (<100 kb, or even intragenic deletions and duplications).
  • This method is not applicable for detecting CNVs in low-complexity regions with segmental duplication.

Split-Read

The split-read methodology uses reads from paired-end sequencing where only one pair has reliable mapping, and the other either entirely or partially fails to map to the genome.

  • The unmapped reads are a potential source of breakpoints at the single base-pair level. However, this method has limited ability to identify large-scale sequence variants (1Mb or longer).

Read-Depth

The read-depth method is based on the hypothesis of a correlation between the depth of coverage of a genomic region and the copy number of the region.

  • This method can detect CNVs of various size (from whole chromosomes down to hundreds of bases). The resolution of this approach is primarily based on depth of coverage where smaller events can be detected at higher depth.

Assembly

In theory, all forms of genetic variation—including CNVs—can be detected by the assembly of short reads if the reads are sufficiently long and accurate.

  • This method was designed to better identify structural variation. However, it’s used less in CNV detection due to the overwhelming demand it can put on computational resources.


Want to learn more about NxClinical?

3Calling CNVs from Whole-Genome Sequencing Data

Whole-genome data has broad utility as it can detect SNVs, insertions/deletions, copy number changes, and both large and small structural variants. Thanks to recent technological innovations, the latest genome sequencers can perform whole-genome sequencing more efficiently than ever.

Unlike narrower approaches to detecting and characterizing CNVs from NGS data such as whole-exome sequencing or gene panels, which analyze a limited portion of the genome, whole-genome data delivers a comprehensive view of the entire genome and has a higher resolution compared to capture-based methods.

  • This makes it ideal for discovery applications, such as identifying causative variants and novel genome assembly.
  • It’s also useful for informing difficult diagnoses in particular clinical contexts as its uniform coverage enables labs to identify much smaller CNVs.
“Take the DMD gene, for example, the nature of the gene is small exons interspersed by large introns. Using traditional capture-based methodology to enrich the coding region only, you’ll likely lose the resolution you need to call tiny events, such as a single exon deletion or duplication which is an importable portion of the variants spectrum. Using genome sequencing or a specifically designed genome-level DMD assay, you can achieve uniform coverage across the gene. The uniform coverage not only facilitates the identification of smaller deletion and/or duplication but also helps to precisely identify the breakpoint which is critical for accurate copy number variant assessment.”

— Dr. Fen Guo, Ph.D., FACMG, FCCMG, Clinical Laboratory Director at PerkinElmer Genomics

Compared to exome data, which only captures one to two percent of the genome and relies on capture-based or PCR-based enrichment, genome data comprises the entire genome—sequencing the coding regions and the non-coding regions. Recent research has suggested that many disease-causing variants may be found in the non-coding regions and are therefore missed by analyzing exomes alone.

Whole-genome data is unique in being PCR-free and non-biased. As a result, PCR-free sequencing methodologies used to call CNVs from whole-genome data provide more uniform coverage across both coding and non-coding regions of DNA. This uniform coverage can increase the likelihood of finding a disease-causing mutation.

Also, because of the uniform coverage, whole-genome data requires relatively lower coverage depths across the genome. Running the same CNV calls from exome data may, for example, require 100x coverage, while the same results could be achieved with only 40x or lower coverage with genome data. 

Whole-genome sequencing is also widely regarded as the superior data modality for accurate breakpoint detection.

“In many cases, whole-genome data enables you to identify breakpoints even at the single nucleotide level because of the uniform coverage across the genome. In addition, whole-genome data also provides insight into some challenging regions such as those involved with trinucleotide repeat disorders.”

— Dr. Fen Guo, Ph.D., FACMG, FCCMG, Clinical Laboratory Director at PerkinElmer Genomics

4Calling CNVs from Whole-Exome Sequencing Data

WES is a form of next-generation sequencing that focuses only on the exons (the protein-coding regions) to detect CNVs, SNPs, and somatic mutations.

WES data is useful for the clinical interpretation of genetic variation discovered in exomes. It typically offers a more cost-effective and higher-throughput alternative to WGS, which involves sequencing every single base pair within an organism's entire DNA sequence at once rather than just parts.

By contrast, WES requires much less data storage and processing power while still providing sufficient coverage for many types of analyses.

  • Compared to traditional platforms like SNP arrays and microarrays, labs calling CNVs from WES data can call CNVs, SNVs, and areas of heterozygosity (AOH) from the same platform—a major unlock for labs looking to enhance and simplify their analysis workflows simultaneously.
  • As Dr. Guo explains below, this holistic analysis capability is important for gaining a uniform constitution, especially when diagnosing imprinting disorders and somatic diseases.
“Before labs recognized that they can use NGS data to call CNVs, WES data was mainly used for calling SNVs or indels. Using NGS data for CNV detection has really stood out in recent years due to the capability of detecting CNV and SNVs simultaneously, especially with nowadays the cost of next generation sequencing reduced dramatically. In addition to CNVs detection, detecting loss of heterozygosity (LOH) is another bonus. This is very important for imprinting disorders. In addition, Copy-Neutral absence of heterozygosity is also part of the disease mechanism for many somatic diseases which labs don’t want to miss.”

— Dr. Fen Guo, Ph.D., FACMG, FCCMG, Clinical Laboratory Director at PerkinElmer Genomics

Like with all types of NGS data, labs should carefully assess the sensitivity and specificity when calling CNVs. Given WES data’s lack of coverage in intron and non-coding regions, some calls may be missed—a risk that can require a step of manual review. Labs should acknowledge the limitations of their assays and make those limitations clear in their reporting.

  • WES data is often not suitable for detecting, for example, single exon deletions or duplications.
  • Also, because of the spiking inherent in WES data, labs may find more false-positive results, which again, can be addressed through the manual review of an experienced expert.


5Calling CNVs from Gene Panels

A gene panel is a targeted set of genes sequenced in a patient to identify mutations that can cause rare diseases. Researchers typically choose the targeted set of genes based on their biological function and/or based on rare disease phenotypes. Several methods, including “capture” and “amplicon” sequencing, are used to sequence a panel of genes in patients with rare diseases.

Mutations identified by gene panels can include SNVs and CNVs. Thanks to recent technological advancements, the clinical research utility of gene panels has expanded greatly in the past decade and is now becoming more affordable for many clinical diagnostic laboratories worldwide.

  • As Dr. Guo describes, compared to MLPA, which has long been considered the gold standard for CNV calling, gene panels offer a high-throughput alternative that enables more granular analysis.
  • Gene panels offer higher coverage compared to MPLA, which means the sensitivity of CNV calls can be comparatively higher.
“The utility of multiplex ligation-dependent probe amplification (MLPA) is limited due to the number of probes included in the kit. It is designed to multiplex up to approximately 50 probes, hence most suitable for one or a few smaller genes. Gene panels enable you to detect the CNVs for all of the genes included in a given panel. Due to being deep-sequenced, the panel data often have high coverage depth, which increases accuracy of CNV detection via the RD approach, although the fact that intronic regions are not included in the analysis may give a somewhat lower sensitivity to certain CNVs compared to using whole genome data.”

— Dr. Fen Guo, Ph.D., FACMG, FCCMG, Clinical Laboratory Director at PerkinElmer Genomics
When calling CNVs from gene panels, Dr. Guo stresses that the specific performance and resolution one can achieve depends entirely on the data at hand—how that gene panel was designed.
“At PerkinElmer Genomics, we have a comprehensive DMD gene panel. When we designed this panel, we not only covered the exon regions but the entire DMD gene. This allows us to call out single-exon-level deletions and duplications. And we can identify breakpoints down to the nucleotide level.”

— Dr. Fen Guo, Ph.D., FACMG, FCCMG, Clinical Laboratory Director at PerkinElmer Genomics
Dr. Guo’s central point for other labs: During the validation of a gene panel, balancing the sensitivity and specificity to provide better performance or resolution for CNV calling is critical.

6Calling CNVs from Low-pass Genome Sequencing Data

Low-pass genome sequencing or low-resolution genome sequencing has been proposed as a cost-effective alternative to detect clinically significant copy number variations.

Compared to traditional genome sequencing at above 30x coverage, low-pass genome sequencing only needs to achieve 0.1-10x coverage depending on its requirement for the resolution of CNV detection.

Low-pass genome sequencing enables labs to have different tiers of assays to achieve various clinical targets. For example, if you wanted to totally cover deletion and duplication events as well as loss of heterozygosity, a minimum of 5x coverage is needed and this would only allow detection of very large (>20MB) LOH events. If you’re only looking for larger CNVs, such as aneuploidy, you can get by with even 0.1x coverage.

In addition, Low-pass CNV detection can be used to identify CNVs that are difficult to detect using other methods—for example, in identifying rare deletions in the genome.

Dr. Guo sees low-pass sequencing continuing to emerge as a primary alternative to microarrays given the often equal or better performance and non-biased analysis.

“I do see low-pass sequencing becoming a more popular alternative to microarrays. For labs looking to call CNVs that don’t have a microarray platform, but do have a sequencing platform, I would strongly suggest they consider low-pass sequencing. In our experience, the performance and resolution are equal to arrays—and sometimes even better. With arrays, your sensitivity is limited to where your probes are located. Low-pass sequencing is basically the same platform as genome sequencing. Rather than 40x coverage, you’re running 5x or 8x coverage—trying to catch the larger CNVs. It’s also important to note that shallow sequencing is PCR-free which means it is non-biased sequencing. It’s uniform data laid out across the entire genome, which isn’t limited to certain regions like with microarray. You may be able to detect events you otherwise would have missed because of probe limitation.”

— Dr. Fen Guo, Ph.D., FACMG, FCCMG, Clinical Laboratory Director at PerkinElmer Genomics
Watch our free webinarGenome sequencing reveals cause of multi-generational split hand/split foot with long bone deficiency—to see how Dr. Raymond C. Caylor, Assistant Director, Molecular Diagnostic Laboratory at Greenwood Genetic Center, utilized genome sequencing and Bionano’s NxClinical software, to provide a diagnosis for a multi-generational family with split hand/split foot with long bone deficiency.
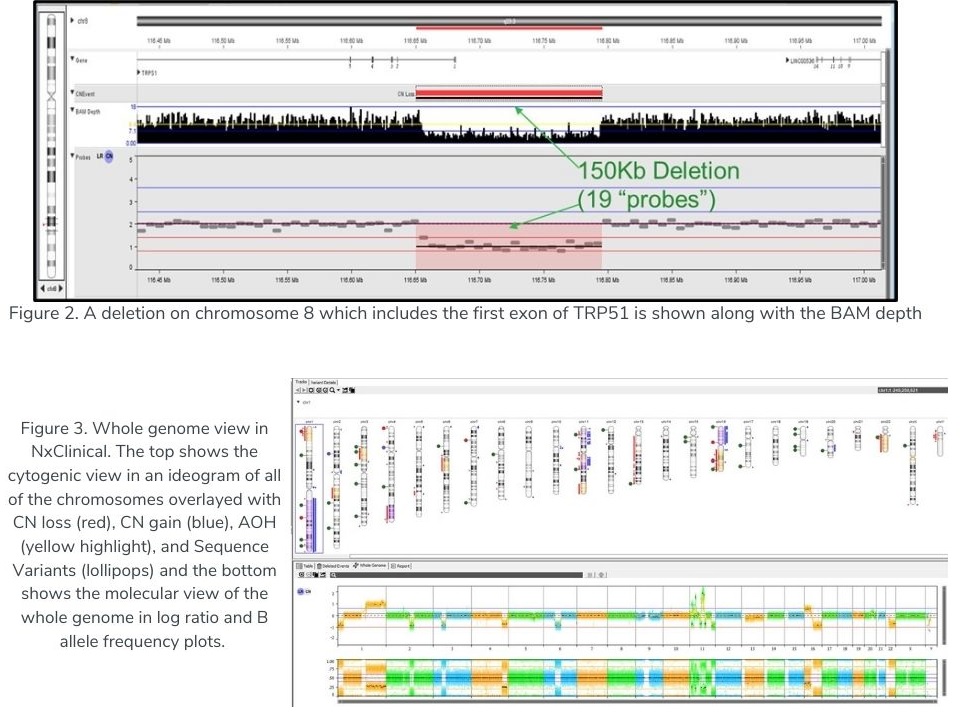
 

7Software for Detecting and Analyzing CNVs from NGS Data

Detecting high-quality CNVs from NGS data has been a long-standing challenge for clinical research labs. Most “out-of-the-box” NGS analysis software tools can’t easily detect or visualize CNVs. Their capabilities are typically limited to certain variant types and sizes or focused on detecting SNVs.

Without robust and convenient CNV calling capabilities, labs are left with an incomplete picture of genomic aberrations and, therefore, can’t thoroughly investigate their patient samples and provide complete results.

Today’s software tools for detecting, analyzing, and interpreting CNVs from NGS data can be broadly divided into two categories: homegrown tools and commercial software.

  • Homegrown tools are typically bespoke systems developed from scratch and integrated with free online CNV tools.
  • Commercial software are purpose-built systems labs purchase and integrate into their workflow with CNV-calling capabilities.
Homegrown CNV tools, while sometimes advantageous from a cost perspective if the lab has very specific and unchanging CNV calling needs, bring several disadvantages that can exact high practical and efficiency costs on a lab.

For example:

  • Homegrown systems and CNV freeware typically apply very narrowly to a specific NGS data type and only that data type. Working with multiple NGS data types—panels, whole-exome, and whole-genome data, for example—means working across various tools that likely don’t integrate elegantly or at all. Also, calling copy number is a small part of the process. An entire system is needed to visualize the events along with clinical annotations and a system for interpreting the results. Adding more tools means compounding workflow inefficiencies that cost labs—and by extension patients—valuable time.
  • Building a homegrown CNV analysis tool almost certainly requires bioinformatics expertise. Teams can’t build a robust CNV calling tool without a team of bioinformatics specialists to establish, optimize, scrape, and train a database. The development effort here can be enormous before such a system is refined to the point where it’s ready for clinical use. Most labs simply don’t have an in-house bioinformatics team to build and continuously maintain and refine such a tool.
  • Homegrown CNV tools often deprecate quickly. NGS is not a static field. New capabilities give labs regular opportunities to advance the speed and quality of their genomic analysis. But without a development team that updates their tools, labs often invest significant time and resources in building bespoke tools that quickly fall behind the curve.

Commercial CNV software, on the other hand, enables teams to invest in efficiencies and capabilities that don’t always require in-house bioinformatics or development expertise. These tools tend to be far more user-friendly and keep pace with new developments in NGS capabilities. However, not all CNV software is equal in performance, capability, and ease of use. As Dr. Guo explains, many of the commercial tools in use today treat CNV analysis as an add-on capability:

“From my experience using several software platforms, many commercial platforms that tout CNV analysis were built for SNV calling and interpretation. CNV calling was added on, but the primary interface is still designed for SNV analysis. Many labs needing to call CNVs need to interface with this data at the genomic level and get the whole picture—especially labs coming from the microarray world that want to use a familiar platform.”

— Dr. Fen Guo, Ph.D., FACMG, FCCMG, Clinical Laboratory Director at PerkinElmer Genomics
Dr. Guo urges teams to be thoughtful when evaluating commercial tools against their particular needs—both today and tomorrow:
“You have to be very careful when thinking about the best commercial tool for the type of CNV calling you need to do. Think about the primary purpose you’ll be using it for. Are you only going to be using panels? Exome data only? Or do you think you’ll want a software that analyzes all types of NGS data? Here at PerkinElmer Genomics, we use panels, exome, and genome data, which is why we use software [Bionano’s NxClinical] that covers everything.

Secondly, most CNV software will give you deletions, duplications, and copy numbers. But not all of them call AOH, which is important for imprinting disorders and cancer.

Thirdly, you have to consider the differences in analytical performance between software. You don’t want a high false-positive rate or false-negative rate.

And lastly—and most importantly for me—if you or anyone on your team is a naturally visual person, you need to look at the data visualization and user interface. It needs to be user-friendly and not get in its own way. The copy number events across the genome should be easy to visualize and identify.”

— Dr. Fen Guo, Ph.D., FACMG, FCCMG, Clinical Laboratory Director at PerkinElmer Genomics

So, to quickly recap the key considerations when evaluating commercial CNV calling software:

  • Commercial software is typically more robust, capable, and user-friendly than freeware and homegrown tools.
  • But in comparing one commercial tool to another, it’s critical to evaluate your needs against its capabilities.
  • Not all commercial software can analyze and interpret data across multiple NGS data types.
  • Not all commercial software that calls CNVs also calls AOH, which is critical in certain contexts.
  • False-positive and false-negative rates can vary between tools.
  • User interfaces also vary between tools.

8NxClinical for CNV Detection and Analysis from NGS Data

Here at Bionano Genomics, we equip labs with the single-source software solution they need to overcome these challenges with a single software solution.

NxClinical is the most comprehensive and up-to-date solution for cytogenetics and molecular genetics in one system for analyzing and interpreting all genomic variants, including CNVs, from microarray and NGS data.

  • NxClinical is platform-agnostic. It accepts various data types that enable clinical research laboratories to process CNVs, SNVs, AOH/LOH (and soon structural variants)—all from a single place.
  • These aberrations visualized in one software provide a complete picture of a sample's genome, enabling labs to work significantly more efficiently and confidently.
  • In short, NxClinical brings genuine CNV clarity and resolution to an otherwise difficult data type.

We’ve perfected two algorithms for the detection of CNV and AOH from almost all NGS assays with high sensitivity and low false-positive rates. 

Both are available with NxClinical, the genomics software solution that enables labs to detect CNVs and AOH regions, and visualize SNVs in context, across all microarray and NGS platforms simultaneously—all from a single screen.

  • One algorithm, the “Self-reference” algorithm, can be used for all WGS data regardless of sequencing depth.
  • The second algorithm is the “Multi-Scale Reference” (MSR) algorithm that is also applicable to all NGS data. The MSR algorithm is able to create “virtual” bins with sizes proportional to the expected number of reads offering high-resolution detection of events in areas of interest (e.g. exons) while also providing a helpful genome-wide backbone.

Calling CNVs from Whole-Genome Sequencing Data with NxClinical

With higher depth NGS, smaller CNVs can be detected and integrated with sequence variants to provide a holistic view of the sample.

In “Figure 3” below, the ideogram shows regions of copy number gain (blue bars), loss (red bars), AOH (yellow shading), Allelic Imbalance (purple shading), as well as various types of Sequence Variants (e.g., SNV, In/Del, etc.) as colored “lollipops”.

deletion on chromosome 8As described in Chaubey et al., Journal of Molecular Diagnostics, vol. 22, No. 6 June 2020, researchers used 10x WGS and validated that the NxClinical algorithm detected all CNVs and AOH that were found by high-resolution SNP arrays.

“Figure 2”  above shows a small exonic deletion detected using 10x WGS with the MSR algorithm.

Calling CNVs from Whole-Exome Sequencing Data with NxClinical

Unlike the numerous algorithms available for calling CNVs from WES data that suffer from poor sensitivity or too many false-positive calls, the MSR algorithm has been able to offer the best balance of these competing measures, detecting small true-positives without generating many false-positives. 

The image below shows a small 12Kb deletion overlapping part of MECP2 gene resulting in only 2 virtual probes indicating a small copy number loss. At the same time, with such sensitivity, only four other CNVs were detected that passed the basic filtering stage demonstrating a very low false-positive rate.

12Kb deletion overlapping part of MECP2 gene

Calling CNVs from Gene Panels with NxClinical

With higher depth NGS, smaller CNVs can be detected and integrated with sequence variants to provide a holistic view of the sample.

The MSR algorithm can be applied to any gene panel from a single gene (e.g. DMD test) to large panels having thousands of genes. The image below is from the Illumina TruSightTM Oncology 500 (TSO500) panel showing a somatic cancer profile.

 somatic cancer profile

The cytogenetic complexity of the tumor sample is clearly evident with a large copy number gain of 8p and loss of a large section of 13q. Aberrations associated with genomic scarring, such as Loss of Heterozygosity (LOH), telomeric allelic imbalances (TAI), and large-scale state transitions (LST) can be visualized and manually called with confidence.

Calling CNVs from Shallow Sequencing Data with NxClinical

The MSR algorithm can be applied to detect CNVs from shallow sequencing, including very low-level mosaic events seen in NIPS or ctDNA samples. The image below shows a sample with trisomy 21 detected using 1x WGS.

A large duplication event affecting the q arm of chromosome 21

A large duplication event affecting the q arm of chromosome 21.

CNVs are an important contributor to disease and are required for accurate diagnosis. For clinical sequencing to be fully accepted as a replacement for microarrays and other widely used techniques, it must provide high-quality CNV information. NxClinical can easily and accurately provide that information from various approaches using NGS data.

Free tutorial

Copy number analysis by NGS: Urban legend or true reality?

In this 25-minute webinar, Soheil Shams, Founder & CEO of BioDiscovery, a Bionano Genomics company, uses multiple example oncology cases to demonstrate the most effective workflow and case review benefits of the Knowledgebase in NxClinical.

Get the software trusted by renowned academic and commercial clinical labs to stay on top of demanding, time-sensitive workloads.

Want to learn more about NxClinical?

Book a free personalized demo to assess fit and see NxClinical in action. Let us know you’re interested and we’ll connect on an initial consultation to answer questions and dive a little deeper before demonstrating NxClinical—either with example data or your own.

*NxClinical software is for research use only. It is designed to assist clinicians and it is not intended as a primary diagnostic tool. It is each lab’s responsibility to use the software in accordance with internal policies as well as in compliance with applicable regulations.

WEBINARCopy Number Variant Detection by NGS: Coverage, Uniformity, & Resolution

Dr. Fen Guo, Ph.D., FACMG, FCCMG

Clinical Laboratory Director at PerkinElmer Genomics

View webinar